Articles by "BBC"
2020 agriculture air air pollution alien Amazing android animals apes app Archaeology Arctic circle ash dieback Atmosphere Attack Australia bacteria BBC beautiful beauty biodiversity biology Canada case studies causes chalk writing chernobyl disaster china climate climate change conservation conserve convenient coronavirus cosmic countries COVID 19 cryosphere cyclones difference earth earth day earth hazards EarthScience EC TALKS Ecology ecowatch Ecowatch education effects electric cars electricity endangered species energy engineers env issues env management env news environment Environmental Science evidence Evolution Evolutionary Biology ezymes facts Fanal fear fear of failure fires food forest forset fossil & ruins galaxies garbage global problem gorillas greece green revolution greenland Human Evolution hurricanes hydraulic press ice impacts Incredible industrial revolution information insects interesting facts invaders IPCC italy land land pollution landscapes light lockdown Locusts locusts v/s grasshopper loss Madeira mammals marine motivation mouse Mutation mystery nano scale NASA national geographic Nature Newyork Nitrogen dioxide NMR noise noise pollution ocean oceans oil spill old trees olive orangutans pacific Pakistan pandemic park peace petrochemicals photography Pink lakes planet plants plastic plastic pollution playstore poem pollution ponder protect Rachel Summer rain forest Ramadan kareem recycling renewable research researchers rodents Russia safe practices SAS satisfaction save science situation size social distancing Solar system solution solutions Soothing south korea stars statistics success symptoms technology the Azores the Canary Islands think tank treatment tree planting trees Turtles types UK UK govt ukraine UNESCO US virus water water pollution WHO wildfires wildlife William Wordsworth woodlands WWF Zoo zoology


A study suggests that some types of environment help block the spread of ash dieback disease, which threatens millions of ash trees in the UK.
Landscapes with hedgerows and woods made up of several types of tree resisted the pathogen better than areas where ash trees predominated.
The deadly fungus had been present in Europe for a number of decades before it arrived in the UK in 2012.
The findings have been published in the Journal of Ecology.
Ash trees are one of the UK's most abundant tree species. And it's estimated that ash dieback, could cost the UK economy billions of pounds.
The fungus that causes ash dieback causes the loss of leaves and leads to parts of the tree dying.
The researchers looked at the disease's progress in an area of north-eastern France, monitoring the initial stages of its spread during 2012, which was about two years after the fungus was first recorded in the area.
They then assessed the same area again between 2016 and 2018 once the disease had a chance to establish itself in the countryside.
Benoit Marcais, director of research at the French National Institute for Agriculture, Food, and Environment (INRAE) explained that understanding how the landscape affected the spread and severity of the tree disease was important from a scientific and practical point of view.
"(The) arrival of ash dieback close to my lab in a diversified landscape, with ashes in contrasting situations, offered a good opportunity to make some progress in the question," he said.

Rising from the ashes

Referred to as the common or European ash, the tree - the UK's only native ash species - is scientifically known as Fraxinus excelsior.
Within the UK, it is the third most abundant species of broadleaved tree (after oak and birch), covering 129,000 hectares of woodland.
Ash is a highly important species within the UK's hedgerows and accounts for about 10% of the nation's estimated 123 million "non-woodland" trees.
Ash dieback first arrived on UK shores back in March 2012, when it was found on some ash trees in a nursery. In October of that year, tree lovers' worst fears were realized when it was found in the wild, within a woodland in Norfolk.

Since then, the disease has spread to all parts of the UK. A recent estimate suggested that ash dieback would cost the UK economy £15bn. This estimate arises from the cost of clearing up dead and dying trees and includes lost benefits provided by the trees; through water and air purification and locking in carbon from the atmosphere.

Dr Marcais and his team monitored a network of plots in north-eastern France, looking for evidence of dieback on trees, as well as the presence of the fungus that causes the disease - Hymenoscyphus fraxineus - in the forest litter (the mixture of leaves and other organic material on the forest floor).
He told BBC News that the micro-organism spread quickly and efficiently throughout the study area within a few years of being first recorded.

Manna from science?

The study revealed surprising results, as Dr Marcais explained: "Ash dieback, however, shows very contrasting severity depending on the environment, remaining mild on trees in open canopies (hedges, isolated trees) or on trees in forest with a mixture of tree species and just a few ashes," Dr Marcais observed.
However, locations that had a high density of ash trees, such as ash woodland, did display the consequences of being severely affected by dieback.
Diseased saplings typically display dead tops and side shoots. Lesions are often found at base of dead side shoots. Meanwhile, lesions on branch or stem can cause wilting of foliage above. The disease affects mature trees by killing off new growth.
Dr Marcais said it was surprising to record a high amount of the fungal pathogen in the forest litter yet seeing such as contrast between areas with a high density of ash trees and those areas, such as hedgerows, with a lower density of the trees.

Reassuringly, the findings from the study seemed to support the growing scientific view that the disease will not wipe out ash trees from the landscape in Europe.
But, he added: "The work helps identify the situations where ash is little-affected by ash dieback.
"In particular, we identify that under a certain ash density, the disease will remain mild."
The findings will be welcomed by foresters and policymakers alike, who have been "keen to have more precise thresholds of ash density to improve management, as ash is already common in mixed tree species stands".
However the silver lining this study provides still surrounds a very dark cloud, which tells us that pure ash woodlands are "very harshly struck by the disease".
Source: By Mark Kinver (Environment reporter, BBC News)

How many marine animals die each year from pollution and plastic? 

  • 100 million marine animals die each year from plastic waste alone. 
  • 100,000 marine animals die from getting entangled in plastic yearly – this is just the creatures we find! 
  • 1 in 3 marine mammal species get found entangled in litter, 12-14,000 tons of plastic are ingested by North Pacific fish yearly. 
  • Our marine pollution and debris are hazardous for creatures in the gyres. 
  • Loggerhead sea turtles hunt jellyfish, which unfortunately look remarkably like plastic bags.  
  • The majority of marine life cannot differentiate their food from plastic garbage we’ve dumped. 
  • These animals starve to death, clogging their stomachs with plastic so they can’t eat real food. 
  • For example, Albatrosses and other birds mistake plastics for fish eggs, and they sadly feed them to their chicks, which in turn perish from organ failure or starvation. 
  • Marine plastic pollution is found in 100% of turtles, 59% of whales, and 36% of seals in recent studies. 
  • The air isn’t safe either,more than 90% of all seabirds are found to have plastic pieces in their stomachs. 
  • Mammals like seals drown in the 705,000 tons of discarded fishing nets – this horrifying phenomenon has been dubbed ‘ghost fishing’. 
  • 500 marine locations are now recorded as dead zones globally, currently the size of the United Kingdom’s surface (245,000 km²) 
  • Our coral reefs house some 25% of all marine life known to man. 
  • When it comes in contact with marine plastic, the probability of it dying goes from 4%-89%. 
  • The majority of fish we consume as humans (trout, perch, cisco, etc) would have ingested plastic and microfibers. 

It was believed that due to the vast size of the ocean, we could dump waste and it would not have any impact, however the increase of volumes coupled with the way the gyres and current take move them, this is not the case. How many marine animals die each year from plastic… 100 million is the current estimated figure, and this includes fish, mammals and sea birds.   
When looking at animals affected by water pollution, globally, it’s estimated that 50% of sea turtles are impacted by plastics, ingesting it and dying through their digestive systems getting clogged. For many turtles, jellyfish are a crucial part of their diets, and it just so happened that plastic bags look a lot like them.   
There are 705,000 tons of discarded fishing nets in the ocean, too, and this is another critical threat to many sea mammals like seals, dolphins, whales, and even smaller animals such as fish and sea lions. Getting tangled in these can lead to injury and often death.   
As far as sea birds are concerned, the figures are shocking. Of all species studied, 98% of Albatross are believed to have ingested plastics at some point. This is due to them mistaking the microplastics for fish eggs, passing them to their young as well as consuming them as adults.   
 Fish are absorbing toxins from the ocean and are taking in debris through their gills. Whales take in vast amounts of plastics and waste mistaking it for food, examinations of stranding’s have shown increases in this issue.   
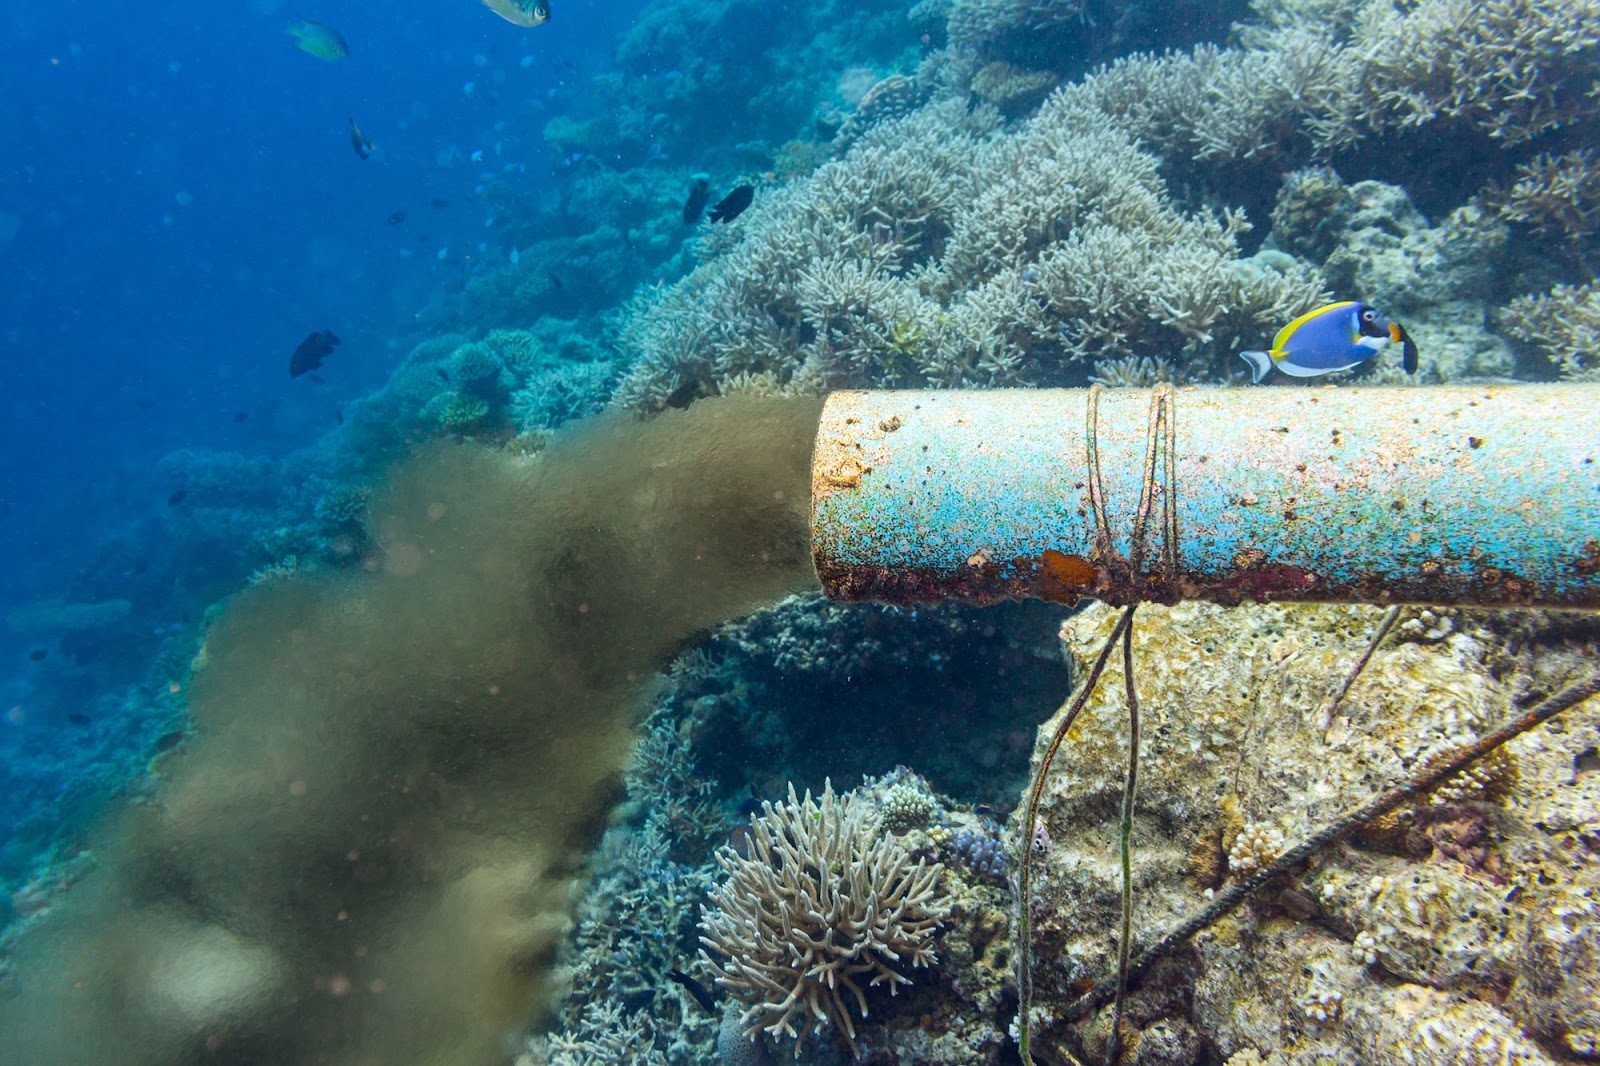
Where we can see waste debris is a huge problem, marine animals are harmed by toxic chemicals like oil and other pollutants are entering the ocean through spills and drainage. This vastly alters the ecosystem and suffocates any marine life coming into contact. 
Sources: OceanCrusaders, PlasticOceans, National Geographic, UNESCO, EarthDay, SAS 

TYPES OF MARINE POLLUTION: FACTS AND STATISTICS 


There are five types of marine pollution: 
Pollutant 1: Ocean Acidification 
The oceans that cover our planet act as a carbon dioxide sponge; when it’s in our atmosphere it gets absorbed by our oceans. The positive effect of this is that our oceans are lowering our global warming by reducing CO2 concentration. The problem is the levels of CO2 are too high and the volume getting absorbed by the sea is impacting pH levels. This is extremely harmful as it changes the whole ecosystem, vulnerable habitats like coral fall victim to this, which are home to 25% of all marine life. 
Pollutant 2: Plastic Debris 
There are 5.25 trillion pieces of plastic estimated to be in our oceans, and this plastic waste is a violent threat to all marine life. Discarded fishing nets get all sorts of creatures tangled in them, fish, turtles, and seabirds eat microplastics mistaken for food. Every year the ingestion of these products leads to a long-winded and horrible death to millions of animals. Furthermore, many of these animals consuming plastics are actually in our food chain, so our waste comes back to poison us too. 
Pollutant 3: Eutrophication 
Eutrophication is a process when the water body has an increase in chemical nutrient concentration. This can spike the growth of plants or, more often than not, where pollution is concerned, cause mass decay, reducing oxygen levels in the water. This results in ‘dead zones’ where the oxygen levels are so low that marine life cannot survive. 
Pollutant 4: Noise 
Human activities can generate a lot of noise within the oceans from sources such as seismic surveys, oil exploration, sonar, and mass cargo shipping. Many forms of marine life depend on their sense of hearing for survival; for example the confusion from the Navy’s sonar has been linked to whale stranding. 
Pollutant 5: Toxins 
Toxins such as DDT, heavy metals, pesticides, phenols, PCBs, etc. are what are called persistent toxins – What are the effects of marine pollution with toxins? they do not disintegrate in our oceans. These toxins enter the bodies of all forms of the marine life food chain and ultimately end up causing disease and death. Of course, we are within this food chain as the apex predator, meaning we are also consuming these biomagnified toxins from our food.
Sources: EcoWatch, BBC, RubiconGlobal, NBC, PlasticOceans1, PlasticOceans2, OceanCrusaders, VOX 

What are the causes of marine pollution? 

  • 80% of pollution in our oceans comes from land-based sources. 
  • Most developing countries dispose of 90% water, and 70% industrial waste gets discharged into our oceans without treatment. 
  • We produce 100,000 chemicals commercially – all of which threaten the ocean through transport accidents and leaking into the soil or atmosphere to reach the sea. 
  • 1950-1998 over 100 nuclear blast tests occurred in our oceans. 
  • 50% of the world’s ship cargo is considered dangerous to the environment; 90% of the planets international trade is transported by ship. 6,000 offshore gas and oil installations provide 30% of the world's energy supply. 
  • The gas and oil industry releases greenhouse gases and causes thousands of spills annually. Oil spills are vastly dangerous to the oceans, but only 12% come from actual spills – the rest leaks in from drains and rivers. 
  • 3,000 different marine species are transported around the planet in 12 Billion tons of ballast waters, causing significant problems with invasive species entering marine ecosystems. In the Baltic sea alone, there are over 100 alien species impacting marine life. 
  • 80% of global marine pollution comes from agriculture runoff, untreated sewage, discharge of nutrients and pesticides. 
  • Coastal areas get significantly impacted by fertilizer runoff from lawns and farms. These nutrients cause algal blooms to flourish and dissolve the water's oxygen levels. These harmful algal-based blooms have tripled since 1984, closing beaches and killing fish. 
  • Annually, the Mississippi River flows 1.5 million tons of nitrogen pollution into the Gulf of Mexico. 
  • The U.S Navy uses a high-intensity sonar for training – this has been linked to whale strandings. 

As you can see from the causes of marine pollution statistics above, there are many chemicals, gases, oil spills, and even nuclear tests that have damaged marine life as we know it. Through cargo shipping we’ve also managed to disturb nature’s ecosystem by moving invasive species of marine life into habitats they shouldn’t be in.   
The items we throw away, chemicals we produce, including CO2 emissions, will make their way to the sea even if the source is 100’s of miles away from the coastline. 
When looking at marine pollution and in particular marine plastic pollution coming from us, there were three leading causes:   
Marine pollution causes 1: Discarding materials that can be recycled.   
Materials that can be recycled but get put into regular bins often will end up in landfills, and some countries don’t even have recycling programs as an option. When these items end up in landfills, the toxins can seep into the soils and make their way to the ocean through rivers; alternatively, many lightweight plastics can blow away in transit or from the landfill into drainage and rivers.   
Marine pollution causes 2: Everyday littering   
Similar to our wastes journey through not recycling, when we discard plastics and other potentially toxic materials through littering, our drainage and rivers are what carry it to the sea. Rainwater or wind can move the waste we leave behind into these drainage routes that go to the ocean.   
On a larger scale than our footprint, there is also a problem with illegal dumping of waste.   
Marine pollution causes 3: Products and chemicals that go into our drains.   
There are products we use on a day to day basis that many people improperly discard down the toilet, such as sanitary products, cotton buds, and wet wipes. A lot of people also don’t realise that when we wash our clothes, the majority are made from materials that are classed as plastics – these release microfibers as well, and yet again follow our own drainage to the sea.   

Sources: WorldOceanNetwork, Mission Blue, WWF, NRDC, UNESCO, RubiconGlobal 

Ultimate Roundup of Marine Pollution Facts: The Causes and Impact on both Marine and Human Life.
The ocean is one of the most unexplored parts of our planet, with a magnitude of undiscovered species and mysteries. It turns out from the studies conducted over the last few decades, this magnificent environment is under serious threat from human intervention, with plastics set to outnumber fish by 2050.   
Marine life, as we know it, is suffering irreparable damage from the chemical pollution of the waters and the millions of tons of mismanaged waste dumped in the oceans each year. The result is a planetary crisis with over 100 million marine animal’s lives get lost every year, and the decay of the ocean's ecosystem.   
Almost 1,000 species of marine animals get impacted by ocean pollution, and we now have over 500 locations recorded as dead zones where marine life cannot exist. How did this happen, what is causing the most damage, find out everything below in the marine pollution statistics roundup. 
Shocking Ocean Pollution Statistics:  
  • 100 million marine animals die each year from plastic waste alone. 
  • 100,000 marine animals die from getting entangled in plastic yearly – this is just the creatures we find! 
  • 1 in 3 marine mammal species get found entangled in litter, 12-14,000 tons of plastic are ingested by North Pacific fish yearly. 
  • In the past 10 years, we’ve made more plastic than the last century. By 2050, the pollution of fish will be outnumbered by our dumped plastic. 
  • The largest trash site on the planet is the Great Pacific Garbage Patch, twice the surface area of Texas, it outnumbers sea life there 6 to 1.
  • China is ranked #1 for mismanaged waste and plastics. However, the US is in the top 20 with a more significant waste per person contributions.
  • 300 Million tons of plastic gets created yearly, and this weighs the same as the entire human population, and 50% is single-use only. 
  • There are 5.25 trillion pieces of plastic waste estimated to be in our oceans.
  • 269,000 tons float, 4 billion microfibers per km² dwell below the surface.
  • 70% of our debris sinks into the ocean's ecosystem, 15% floats, and 15% lands on our beaches.
  • In terms of plastic, 8.3 million tons are discarded in the sea yearly. Of which, 236,000 are ingestible microplastics that marine creatures mistake for food. 
  • Plastics take 500-1000 years to degrade; currently 79% is sent to landfills or the ocean, while only 9% is recycled, and 12% gets incinerated. 
  • 1950-1998 over 100 nuclear blast tests occurred in our oceans.
  • 500 marine locations are now recorded as dead zones globally, currently the size of the United Kingdom’s surface (245,000 km²) 80% of global marine pollution comes from agriculture runoff, untreated sewage, discharge of nutrients and pesticides.
  • 90% of the worldwide ocean debris comes from 10 rivers alone 
Which countries cause the most marine pollution? 
  • China is ranked #1 for mismanaged waste and plastics; however, the US is in the top 20 with a more significant waste per person contributions.
  •  50% of the world’s plastic gets manufactured in Asia, in China holds 18% of the world’s population, and 29% of this plastic gets created there. 

According to Statista’s ocean pollution by the country report. Back in 2010, China was responsible for 8.8M metric tons of waste that are considered ‘mismanaged.’ An estimated 3.53M metric tons of this ended up in our oceans. However, it’s important to note that China has the largest population on the planet since then China has set a target to have 35% of its plastic waste recycled by 2020.   
Other ocean pollution by country statistics from the same report show 3.2M tons of mismanaged waste and 1.29M ending up in the oceans from Indonesia, a country with 264 million population. In comparison, the United States has 327 million people living there with 0.11 million metric tons of waste entering the sea. Shockingly, at the time of the report in 2010, both China and Indonesia accounted for over a third of the planet's plastic waste, according to the Wall Street Journal.   
The ocean pollution statistics by country report comes from a team of researchers from Australia and the United States led by Jenna Jambeck. They went about to analyze the levels of plastic waste within the world’s oceans.   
Sources: BBC, National Geographic, Statista 

MKRdezign

Contact Form

Name

Email *

Message *

Powered by Blogger.
Javascript DisablePlease Enable Javascript To See All Widget